
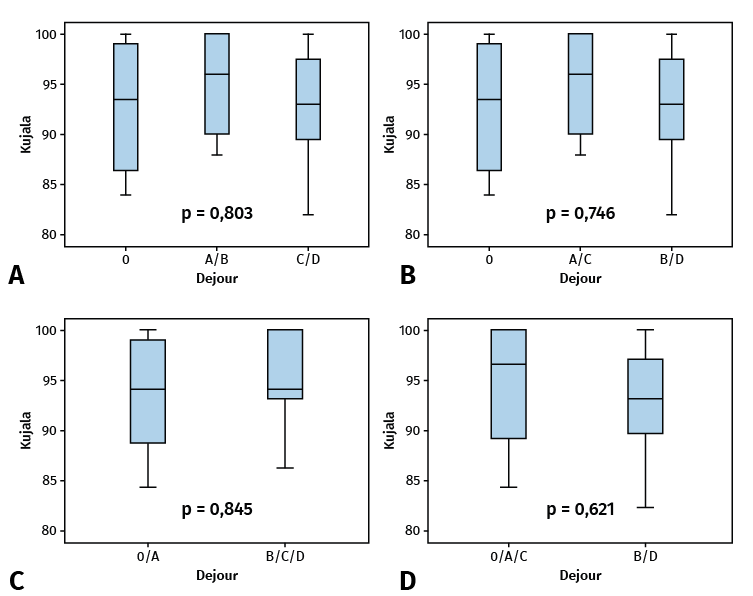
Figure 3. Statistical plots: comparative analysis of the functional outcomes measured by the Kujala score according to the degree of dysplasia (TD): absence of TD versus types A and B, and versus types C and D (A); absence of TD versus types A and C, and versus types B and D (B); absence of TD and type A versus types B, C and D (C); absence of TD and types A and C versus types B and D (D).